Launch of Energy Perspectives’ iGIS/LNG Global Gas Intelligence Solution
As recent tumultuous energy market events have shown, the value of, and need for powerful business intelligence has never been greater. Market information and tools to support companies’ operations in conventional natural gas and power markets have evolved strongly over the past two decades. Yet in the rapidly evolving global LNG market the paucity and incompleteness of concepts and solutions is notable.
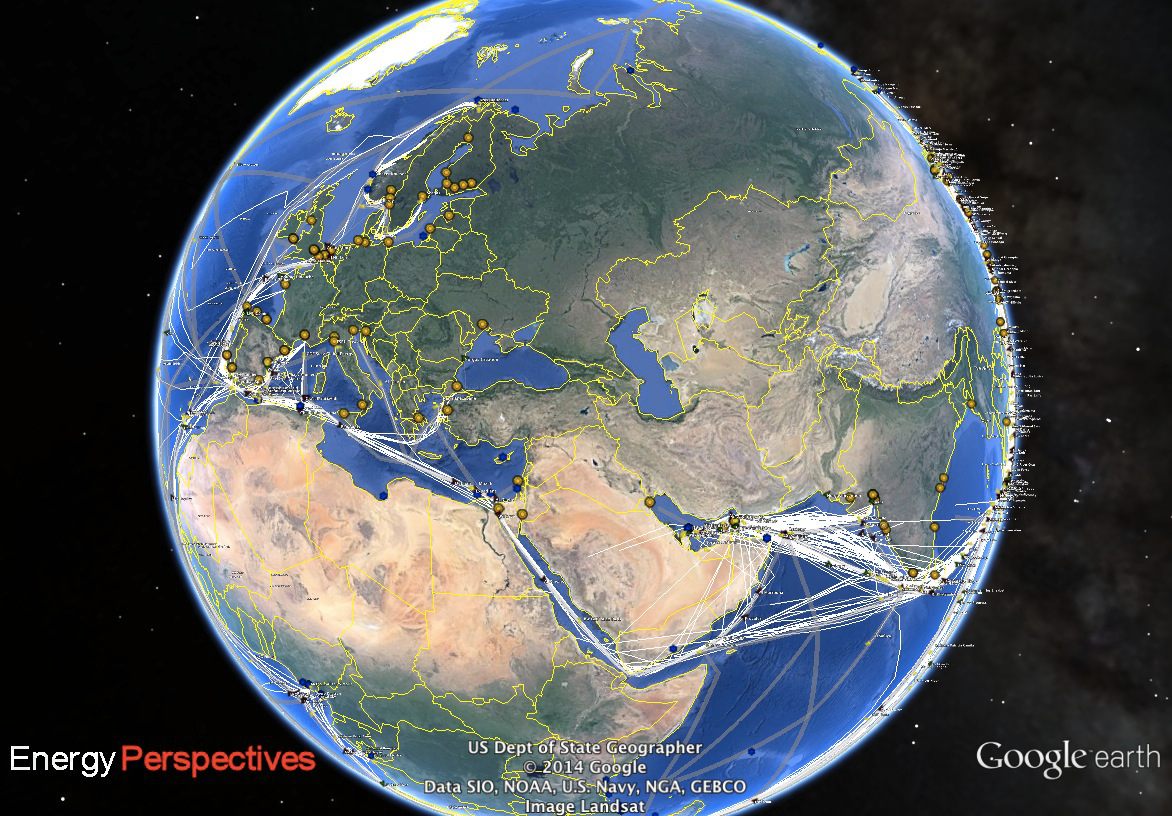
We have in a parallel post examined the dramatic effects of Qatar’s LNG export drive to Europe and the need to have an integrated perspective of global LNG and pipeline markets. Based on our work with natural gas solutions for over 30 years, Energy Perspectives is now bringing a range of solutions to a common platform – for energy specialists by energy specialists.
In preparation for our August formal launch date, we will now start publishing a selection of statistical indices and graphics that we plan to continue as a regular service. Initially we will provide two charts to help analytics and decision-making in the globally interconnected gas world: energy demand drivers and key global metrics for LNG transport:
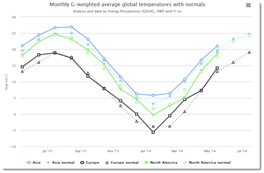 The winter of 2013/14 showed the importance of global temperatures for energy prices, with colder than normal winter in North America and above normal temperatures in Europe and Asia. Drawing on our comprehensive integrated databases and data feeds, we will release a monthly and 10-day temperature chart for Asia, North America and Europe, weighted by national natural gas demand. Tracking nearly 1000 weather locations worldwide, the report will also be offered as a detailed service at a national and sub-national level.
Click to generate and display the full temperature chart
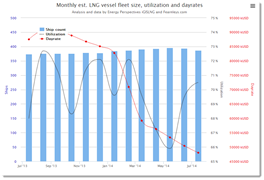 The second chart addresses the importance of global LNG shipping in global gas arbitrage and combines our real-time estimate of LNG vessel fleet utilization and number of active vessels, shown with vessel day rates from Fearnleys. This chart is constructed from a complete global overview of LNG ships at any time. As the sample shows, there is a strong correlation between dayrates, fleet utiliziation and ultimately lay-up when dayrates are low.
Click to generate and display the dynamically generated full LNG fleet chart
Note that the charts have powerful live features that allow selection and deselection of any series, printing and file export. It is our plan that these charts are made available as a regular, dynamically updated service which will also be augmented by download services and subscription analytics. The full iGIS/LNG solution to be launched in August additionally brings a number of other elements, both for regional intelligence and for the all-essential global forward-looking perspective.
For further information, please write us at contact@eiklandenergy.com or call +47-99517555.