Has OPEC killed the shale oil Troll?
Another decline in the US oil rig count was reported on 17 April 2015 by BakerHughes, 26 rigs down. Overall, oil rig count is down by more than 50% since December, to 734. Activity in some basins, including pioneering Barnett, is all but wiped out. Many long-term rig contracts have been exited, apparently without major penalties, and costs have come down 10-15% overall. The bottom is in sight.
Energy Perspectives reported in December our early assessment of the first-year effect of a sustained 40% decline in the oil price on US shale oil production to be about 0.5 mill. Bbls/day. North Dakota, the fastest reporter with only a 6 week lag, saw a 50k Bbl/day reduction in January and February output. The decline will now likely accelerate.
Yet, precise forecasting of total US shale oil output is difficult. The effects of advancing technology, hedging, long term rig contracts and lease holding obligations combine with limited public data about the resource base and corporate strategies to make analysis very hard. This is also a reason why there is currently so much speculation in the market.
However, the US natural gas price drop in 2011 and the ensuing activity adjustments give valuable insights. Gas drilling virtually halted in Haynesville and in marginal parts of Marcellus at that time. Sweet-spots of Marcellus, concentrated in the northeast and southwest, remained vigorous and a 50% increase in average well IP – initial production – stemmed a potential gas output decline. Drilled but uncompleted wells added a major buffer. The core of Marcellus is still healthy.
For this round with low oil prices the much improved technology and lower costs since 2011 must be accounted for, but also the new knowledge of the resource distribution, which is log-normal. These factors and experiences were assembled in our updated work to resolve how rig demand, rig availability and prospect targeting work within the resource distribution framework.
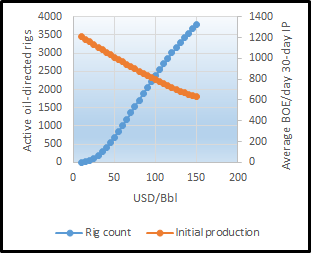
The results confirm the direction of earlier analysis, with two major exceptions. There is a much higher ultimate production potential at high oil prices, when rigs are available. Rig construction capacity has grown to more than 150 per year, and new-builds drove the 2014 oil production expansion. Conversely, oil output reaches the “basement” and collapses at about 25 USD/Bbl as the number of still-profitable super-sweet prospects drops. Activity and production decline is therefore significantly larger at very low oil prices than in the earlier forecast.
 With Brent prices at 60 USD/Bbl. US shale oil production can ultimately fall from the start of year production of 5.3 mill. Bbl/day by 1 mill. Bbl/day. Factoring in typical shale well decline profiles, completion of uncompleted wells and lease holding obligations, however, the first-year decline will most likely be 30-50% of this, or 0.3-0.5 mill. Bbl/day.
What do such results mean for global prices and market dynamics? Currently, there seems to be little reason for OPEC to change its stance on market share in their upcoming June ministerial meeting. In fact, at oil prices above 60 USD/Bbl the “shale oil Troll” will again raise its head. Such dynamism is also reflected by earlier US shale gas experience. On its side, associated gas, at 25% average share of wellstream energy, will follow oil output. An upward natural gas price momentum appears to be building, which could impact coming US LNG exports.
 OPEC has good reason to be worried about the competitive threat from US shale oil. The result of the “market test”, still ongoing, appears to be that oil prices must be no higher than 70 USD/Bbl, or the active oil-directed rig count to be less than 1200, to contain US shale oil output at the present level.
The current Energy Perspectives 5-year oil price recommendation for investment purposes is in line with this, with a maximum level of 70 USD/Bbl. Increasing demand-side weaknesses indicate that portfolios should be careful about long-term exposures.