Risks to LNG supply – the 26 February PNG earthquake in perspective
The recent series of earthquakes in Papua New Guinea culminated on 26 February with a 7.5 Richter scale quake, causing damage at the 8.5 mtpa PNG LNG liquefaction facility north of Port Moresby, almost 600 km from the quake epicenter. Eikland Energy iGIS/LNG site intelligence data shows that both trains were operating at high utilization at the time of the quake.
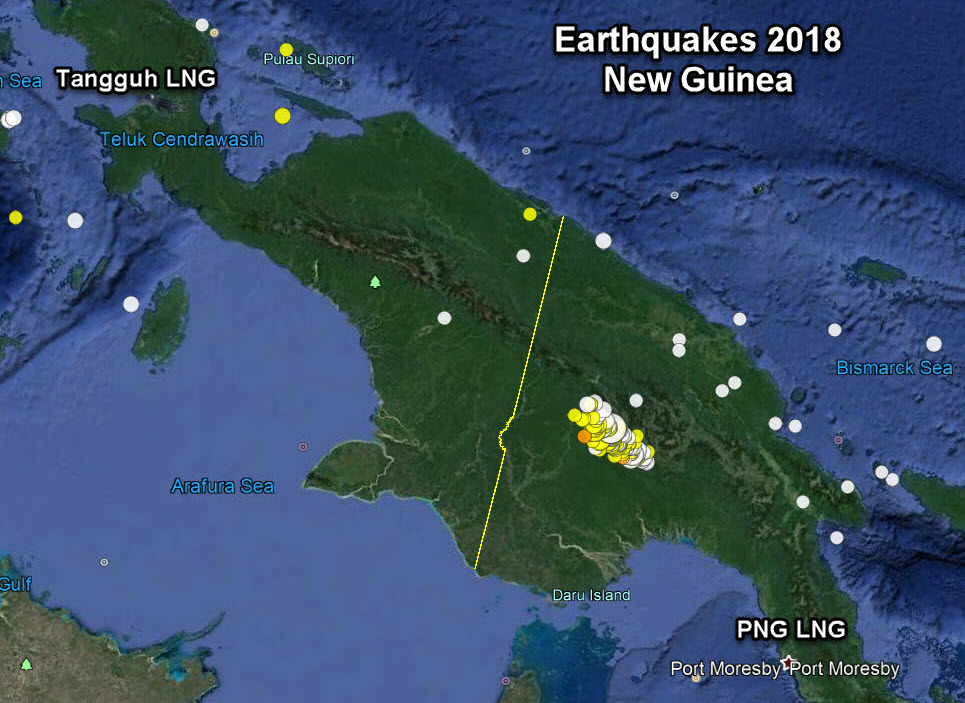
The Exxon-operated plant is expected to be closed for eight weeks and buyers (CPC, Sinopec, Osaka Gas and Tokyo Gas) have received Force-Majeure notification. The plant’s gas supply comes from fields about 300 km from the epicenter, and while there have been no reports of pipe ruptures, the FM period will undoubtedly be used to inspect the full supply chain.
No damage has been reported on the Tangguh LNG plant, 1200 km from the quake, on the opposite, north-western Indonesian side of the island, although a subsequent 5.1 scale quake on 4 March, 270 km from the plant, must have been registered locally.
Earthquake-prone Japan has always had intense attention on earthquake-proofing their regasification plants and suffered little damage from the massive quake in 2011 that closed all nuclear plants. However, the PNG LNG outage is a reminder that LNG liquefaction plants are much more complex and delicate instruments, inherently more exposed to damage from earthquakes than regasification terminals. In addition, the January ruptures of two storage tanks (S-101 and S-103) at Sabine Pass LNG remind that even simpler components may be exposed in areas with low earthquake incidence.
As the global LNG market continues to grow, and with a continued increase in the number of LNG trains, statistics dictate that there will be more incidences of damage and subsequent LNG plant outages from events of the nature.
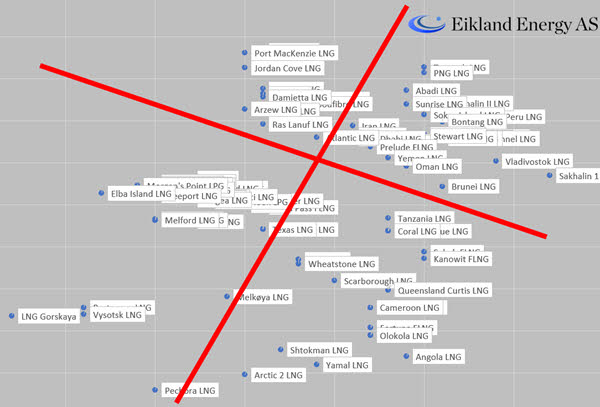
Eikland Energy has examined the risk exposure of all existing and planned LNG plants in the world based on global earthquake data from the USGS for the last 20 years, about 500,000 earthquakes in total. The result metrics show that the plants are nicely grouped into the four quadrants of the classic risk matrix, with a roughly even number of sites in each of the four quadrants. (The analysis of regasification plants gives a division and classification along precisely the same lines.)
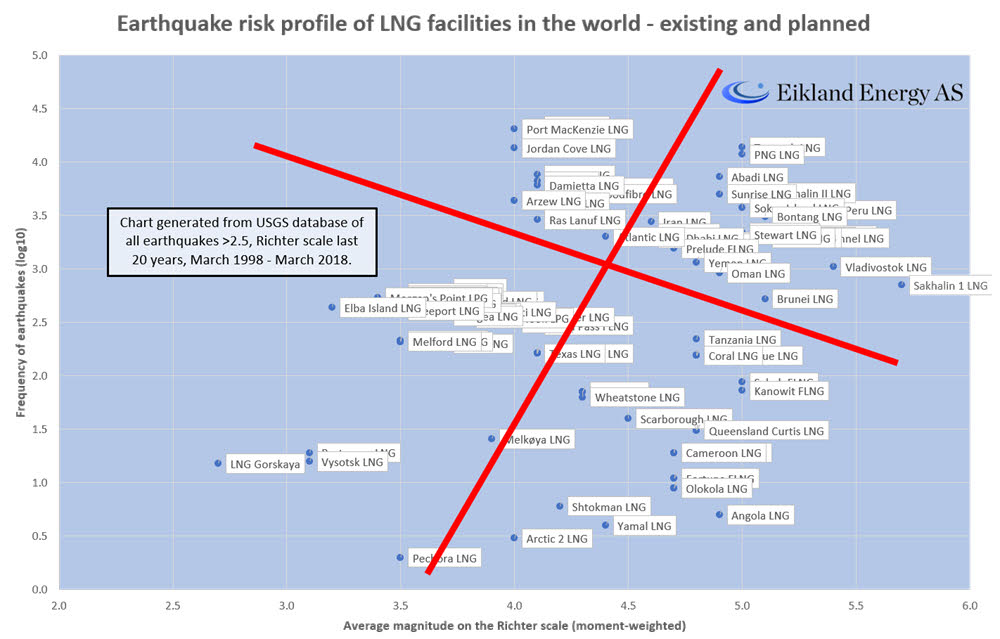
The analysis confirms that PNG LNG is highly exposed to earthquake risk both for the high average Richter scale, and the high frequency of earthquake incidence in the area. Tangguh LNG shows an even higher frequency than PNG LNG, while Sakhalin II and Peru LNG have lower frequency, but on average face larger earthquakes when they happen. The largest LNG complex in the world, Qatar LNG at Ras Laffan, comes in near the average on both dimensions.
Portfolio risk management use a multitude of risk dimensions, including contract risk, political and technological risk, and events for the nature. Large companies have the benefit of being able to structurally and continually optimize exposure under a “value at risk” concept. The devastations of the hurricanes of 2017 in the Caribbean and US Gulf, and recent series of earthquakes again remind the destructive forces of single events.
As the LNG industry continues to grow, the earthquake risk matrix presented here is a reminder of the need for broad systematic risk measurement and management that spans the entire LNG value chain. Natural events have strongly shaped the LNG industry in the past and will continue to do so in the future on a much bigger volume base. Early event identification, fast response and operational flexibility has not characterized the LNG industry historically but is now becoming a necessity.